From HTML to Machine learning
(Posted on Nov-14-2016)
Having started my career as a web developer, the first programming language learnt was HTML. Over these years worked on various technologies both on Microsoft and Open source, projects ranging from web application to Big Data.
This blog is about overview of creating and consuming a model based on linear regression using machine learning. This is my first blog.
Let us understand a little bit of basics before delving in to Machine learning.
What is linear regression?
Linear means straight line, regression means estimating the relationship between variables. If the relationship between variables is a straight line then it is called linear regression.
What is simple linear regression?
If there is one independent variable for a dependant variable and the relationship is straight line then it is called simple linear regression like the relationship between voltage and current, time taken and distance travelled which is normally of the form y=mx + c.
If there are more than one independent variables then it is called multiple linear regression, for example temperature at a given lattitude and longitude, mileage of an engine based on road condition and engine capacity, etc.we are going to focus only on simple linear regression in this blog post.
Let's try to use linear regression in machine learning.
Equation of the line joining two points( x1,y1) and (x2,y2) is y - y1 = m(x -x1) where m= (y2 - y1) /( x2 - x1). Once we have the value for m, we can find the value of y for any given x, which falls on the line, using the above formula.
Similarly for a line joining "n" points (x1,y1),(x2,y2),....(xn,yn) the slope "m" can be computed using Least Squares method
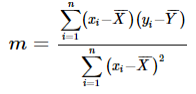
and Y - intercept C
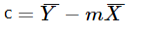
Where X̄ is the average of x values and Ȳ is the average of y values.
So, once we get the values for "m" and "c" we can predict the values of "y" for given values of "x" using the formula y = mx + c
Assuming that data points fall closely to straight line (not exactly a straight line) computer can find the values for "m" and "c" and hence the equation of best fit of a line using least squares method algorithm as mentioned above. The equation thus generated depends on the input data(points). With this equation we can predict the values of "y" based on the values of "x"
This process of machine, learning from the data is known as machine learning.
How to predict ?
The idea behind prediction is, find the parameters of the equation (values of m and c) with the given data and using those parameters in the equation to get the y values for the x data point that we want(to predict).If our computer can build this equation based on our input data, then we can use that equation to predict the values for unknown/future data.
Finding the equation with known data is known as "training" (the model) and verifying the equation with existing data is known as "testing" (the model). In programming parlance a model is an object built from an algorithm.
Let's take case of simple linear regression, where the dependant variable (y) has one independent variable (x). Let's try to find the relationship between no. Of square feet(X) and price of the house(Y) and using this relationship we can predict the price for any given sq.feet for which we don't know the price. Let's take the below sample data.
Before finding the relationship let's visualize the data using excel scatter plot or with visualization provided by zeppelin / Jupyter notebook on Apache Spark
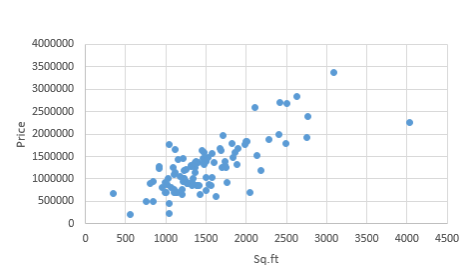
Prime facia there appears to be a positive correlation.
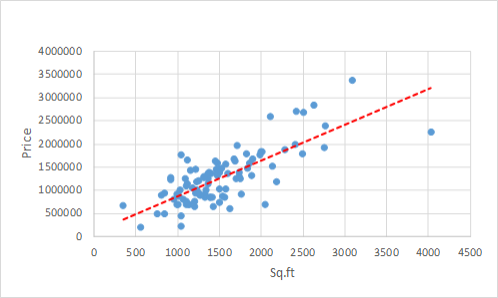
Our intention is to find the line of best fit. Let's use our code to find this.
I am going to use Apache Spark ML with Scala.
Using Apache spark for this amount of data is an over kill, but the point is this solution would work on huge amount of data.
One way to create a spark cluster is to use the free databricks cloud community edition.
The input for linear regression algorithm is label and feature.Label is predictor variable i.e item we are going to predict, in this case it is price, feature is the independent variable that label depend on, in this case it is Sq.ft.
Upload the sample data as csv without headers to a folder say "/tmp".
val dataPath = "/tmp/housePrice.txt"
Define the schema "House" for the data
case class House(price: Double, sqft: Long)
Load the data in to dataframe using the schema defined.
import spark.implicits._
val priceDF = spark.sparkContext
.textFile(dataPath)
.map(_.split(","))
.map(rows => House(rows(0).trim.toDouble, rows(1).trim.toLong))
.toDF()
Create vector from the input features (in this case "Sq.ft" is the only feature) using vectorAssembler class
import org.apache.spark.ml.feature.VectorAssembler
val vectorAssembler = new VectorAssembler().setInputCols(Array("sqft")).setOutputCol("featuresVector")
Transform the input features in to vector.
val inputDF = vectorAssembler.transform(priceDF)
Create the linear regression model, set the label column and features column of the input data, and other parameters as below.
import org.apache.spark.ml.regression.LinearRegression
val lr = new LinearRegression()
.setFeaturesCol("featuresVector")
.setLabelCol("price")
.setPredictionCol("predictedValues")
.setMaxIter(5)
.setElasticNetParam(0.5)
Train(build) the model using input data.
val priceModel = lr.fit(inputDF)
Now we got the model, let us test the model using unknown data.
Create test data with label(price) as "0" and the Sq.ft for which we want to predict the price say for 550 sq.ft and 1000 sq.ft.
val testList = List("0,550","0,1000")
val testRows = testList.map{_.split("\\,")}
val testDF = testRows.map{row => House(row(0).toDouble,row(1).toLong)}.toDF()
val testInput = vectorAssembler.transform(testDF)
Now we got the test data in the required form.
Apply the test data on the above created model to find the unknown price for the input.
val prediction = priceModel.transform(testInput)
Get the output using
prediction.show
Output
|price|sqft|featuresVector| predictedValues|
+-----+----+--------------+-----------------+
| 0.0| 550| [550.0]|530555.4361657018|
| 0.0|1000| [1000.0]|877090.0526306548|
+-----+----+--------------+-----------------+
Typically the process would be train,test, evaluate / fine tune , deploy to production. But for the sake of simplicity just created and used the model.
We got the model now, how can it be consumed by end user / business? We can load this model in a Java program and can be exposed as REST webservice. One easy way, is to build the model in Scala and consume it in Java (using Spark ML persistence train / test the model in scala and save it. Load the saved model using Java and expose it as webservice).
Once we have this webservice, it can be consumed in lot of ways, one of them is through JavaScript embeded in HTML.
So with the input data we built the model and predicted output using this model. The system calculated the formula based on the input data and predicted using this formula for the given data. From the end users perspective the machine learned from the input data and predicted values for unknown data based on its understanding of the input data.......isn't it interesting?
About the Author: Manoharan D, Having 1.8 decades of IT industry experience, working for a private IT company, living in a town near Chennai, India.
Let us understand a little bit of basics before delving in to Machine learning.
What is linear regression?
Linear means straight line, regression means estimating the relationship between variables. If the relationship between variables is a straight line then it is called linear regression.
What is simple linear regression?
If there is one independent variable for a dependant variable and the relationship is straight line then it is called simple linear regression like the relationship between voltage and current, time taken and distance travelled which is normally of the form y=mx + c.
If there are more than one independent variables then it is called multiple linear regression, for example temperature at a given lattitude and longitude, mileage of an engine based on road condition and engine capacity, etc.we are going to focus only on simple linear regression in this blog post.
Let's try to use linear regression in machine learning.
Equation of the line joining two points( x1,y1) and (x2,y2) is y - y1 = m(x -x1) where m= (y2 - y1) /( x2 - x1). Once we have the value for m, we can find the value of y for any given x, which falls on the line, using the above formula.
Similarly for a line joining "n" points (x1,y1),(x2,y2),....(xn,yn) the slope "m" can be computed using Least Squares method
and Y - intercept C
Where X̄ is the average of x values and Ȳ is the average of y values.
So, once we get the values for "m" and "c" we can predict the values of "y" for given values of "x" using the formula y = mx + c
Assuming that data points fall closely to straight line (not exactly a straight line) computer can find the values for "m" and "c" and hence the equation of best fit of a line using least squares method algorithm as mentioned above. The equation thus generated depends on the input data(points). With this equation we can predict the values of "y" based on the values of "x"
This process of machine, learning from the data is known as machine learning.
How to predict ?
The idea behind prediction is, find the parameters of the equation (values of m and c) with the given data and using those parameters in the equation to get the y values for the x data point that we want(to predict).If our computer can build this equation based on our input data, then we can use that equation to predict the values for unknown/future data.
Finding the equation with known data is known as "training" (the model) and verifying the equation with existing data is known as "testing" (the model). In programming parlance a model is an object built from an algorithm.
Let's take case of simple linear regression, where the dependant variable (y) has one independent variable (x). Let's try to find the relationship between no. Of square feet(X) and price of the house(Y) and using this relationship we can predict the price for any given sq.feet for which we don't know the price. Let's take the below sample data.
Price,Sq.ft
145000,1240
68000,370
115000,1130
69000,1120
163000,1710
69900,1010
50000,860
137000,1420
121300,1270
70000,1160
64500,1220
167000,1690
114600,1380
103000,1590
101000,1050
50000,770
85000,1410
22500,1060
90000,1300
133000,1500
90500,820
260000,2130
142500,1170
160000,1500
240000,2790
87000,1030
118600,1250
140000,1760
148000,1550
65000,1450
176000,2000
86500,1350
180000,1840
179000,2510
338000,3110
130000,1760
77300,1120
125000,1110
100000,1360
100000,1250
100000,1250
146500,1480
144900,1520
183000,2020
77000,1220
60000,1640
127000,940
86000,1580
95000,1270
270500,2440
75000,1520
81000,980
188000,2300
85000,1430
137000,1380
92900,1010
93000,1780
109300,1120
131500,1900
200000,2430
81900,1080
91200,1350
124500,1720
225000,4050
136500,1500
268000,2530
70700,1020
70000,2070
140000,1520
89900,1280
137000,1620
103000,1520
183000,2030
140000,1390
160000,1880
192000,2780
130000,1340
123000,940
21000,580
85000,1410
69900,1150
125000,1380
162600,1470
156900,1590
105900,1200
167500,1920
151800,2150
118300,2200
94300,860
93900,1230
165000,1140
285000,2650
45000,1060
124900,1770
147000,1860
176000,1060
196500,1730
132200,1370
88400,1560
127200,1340
Before finding the relationship let's visualize the data using excel scatter plot or with visualization provided by zeppelin / Jupyter notebook on Apache Spark
Prime facia there appears to be a positive correlation.
Our intention is to find the line of best fit. Let's use our code to find this.
I am going to use Apache Spark ML with Scala.
Using Apache spark for this amount of data is an over kill, but the point is this solution would work on huge amount of data.
One way to create a spark cluster is to use the free databricks cloud community edition.
The input for linear regression algorithm is label and feature.Label is predictor variable i.e item we are going to predict, in this case it is price, feature is the independent variable that label depend on, in this case it is Sq.ft.
Upload the sample data as csv without headers to a folder say "/tmp".
val dataPath = "/tmp/housePrice.txt"
Define the schema "House" for the data
case class House(price: Double, sqft: Long)
Load the data in to dataframe using the schema defined.
import spark.implicits._
val priceDF = spark.sparkContext
.textFile(dataPath)
.map(_.split(","))
.map(rows => House(rows(0).trim.toDouble, rows(1).trim.toLong))
.toDF()
Create vector from the input features (in this case "Sq.ft" is the only feature) using vectorAssembler class
import org.apache.spark.ml.feature.VectorAssembler
val vectorAssembler = new VectorAssembler().setInputCols(Array("sqft")).setOutputCol("featuresVector")
Transform the input features in to vector.
val inputDF = vectorAssembler.transform(priceDF)
Create the linear regression model, set the label column and features column of the input data, and other parameters as below.
import org.apache.spark.ml.regression.LinearRegression
val lr = new LinearRegression()
.setFeaturesCol("featuresVector")
.setLabelCol("price")
.setPredictionCol("predictedValues")
.setMaxIter(5)
.setElasticNetParam(0.5)
Train(build) the model using input data.
val priceModel = lr.fit(inputDF)
Now we got the model, let us test the model using unknown data.
Create test data with label(price) as "0" and the Sq.ft for which we want to predict the price say for 550 sq.ft and 1000 sq.ft.
val testList = List("0,550","0,1000")
val testRows = testList.map{_.split("\\,")}
val testDF = testRows.map{row => House(row(0).toDouble,row(1).toLong)}.toDF()
val testInput = vectorAssembler.transform(testDF)
Now we got the test data in the required form.
Apply the test data on the above created model to find the unknown price for the input.
val prediction = priceModel.transform(testInput)
Get the output using
prediction.show
Output
|price|sqft|featuresVector| predictedValues|
+-----+----+--------------+-----------------+
| 0.0| 550| [550.0]|530555.4361657018|
| 0.0|1000| [1000.0]|877090.0526306548|
+-----+----+--------------+-----------------+
Typically the process would be train,test, evaluate / fine tune , deploy to production. But for the sake of simplicity just created and used the model.
We got the model now, how can it be consumed by end user / business? We can load this model in a Java program and can be exposed as REST webservice. One easy way, is to build the model in Scala and consume it in Java (using Spark ML persistence train / test the model in scala and save it. Load the saved model using Java and expose it as webservice).
Once we have this webservice, it can be consumed in lot of ways, one of them is through JavaScript embeded in HTML.
So with the input data we built the model and predicted output using this model. The system calculated the formula based on the input data and predicted using this formula for the given data. From the end users perspective the machine learned from the input data and predicted values for unknown data based on its understanding of the input data.......isn't it interesting?
Post your comments
About the Author: Manoharan D, Having 1.8 decades of IT industry experience, working for a private IT company, living in a town near Chennai, India.