Real-Time Sentiment analysis end to end
(Posted on 03-Nov-2018)
RealTime sentiment analysis end to end using Stanford CoreNLP, Apache spark streaming, Hbase, node.js and d3.js.
What is sentiment analysis? Sentiment Analysis is the process of determining whether a piece of writing is positive, negative or neutral.
In this blog let's see how to do real time sentiment analysis for twitter data. Use any keyword of your interest(ex. Big Data,IOT,machine learning) for filtering the streaming data using twitter API, for which sentiment needs to be analyzed.
Various components involved here are
CoreNLP:
We are going to use Stanford CoreNLP package for sentiment analysis. Assumption here is, if the text contains multiple sentences, sentiment of the longest sentence is considered to be the sentiment of the given text. This package is exposed through web server(tomcat) as a REST service.
Retrieve the sentiment using the method RNNCoreAnnotations.getPredictedClass(tree); which returns an integer as output, which needs to be interpreted as below.
0: "Very Negative"
1: "Negative"
2: "Neutral"
3: "Positive"
4: "Very Positive"

With this, for a given text, sentiment score is returned using HTTP method.
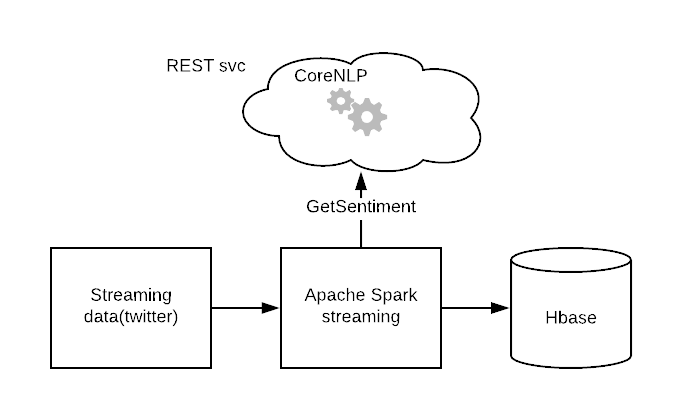
Stream Processing:
Using Apache Spark streaming to process the Twitter streaming data. The steps involves
Storage:
Store the streaming data to Hbase on hadoop cluster(Example).
Data transfer:
Now we have our data in Hbase, we can query the data from Hbase and present it as chart, refreshing the client every few seconds to make it as real time chart.
We are not going to use this technique, instead we will be using push model, whenever new data is arrived in Hbase, it is pushed to the client (in this case web browser) which makes it truly real-time.
Let's have a service which connects the data from Hbase to the chart in clients web browser. We have our data coming in to Hbase table , we have our chart loaded in the client web browser waiting to be updated.

Socket.io to our rescue:
Our orchestration server is built on node.js which monitors particular port for incoming messages and send that to the browser clients which are subscribed to it using socket.io.

Now we just need to push the data to the node.js server listening on a particular port, Hbase Coprocessor does that. Coprocessor is triggered whenever there is a data manipulation(get,put,delete), here we use postPut event, which is triggered after Hbase insert. Coprocessor is similar to trigger in RDBMS.
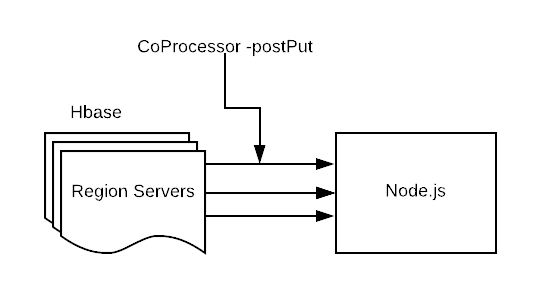
Our node.js process has two ports, tcp for incoming data and http for outgoing data. Hbase Coprocessor pushes the data in to the tcp port, which is then pushed to the client (example).
Data from the TCP stream is passed to the http server, which pushes data to the client using socket. io. This is possible because the tcp server and the http server runs inside the same node.js process.

Visualization:
Using d3.js create the charts (example). Use socket.io.js for realTime communication between the browser and server. Socket.io emits the data using this method in the browser, whenever data arrives in the server.
socket.on('emit_from_server', function(data){
.....
.....
})
Update the chart whenever data is emitted, thus making it real-time.
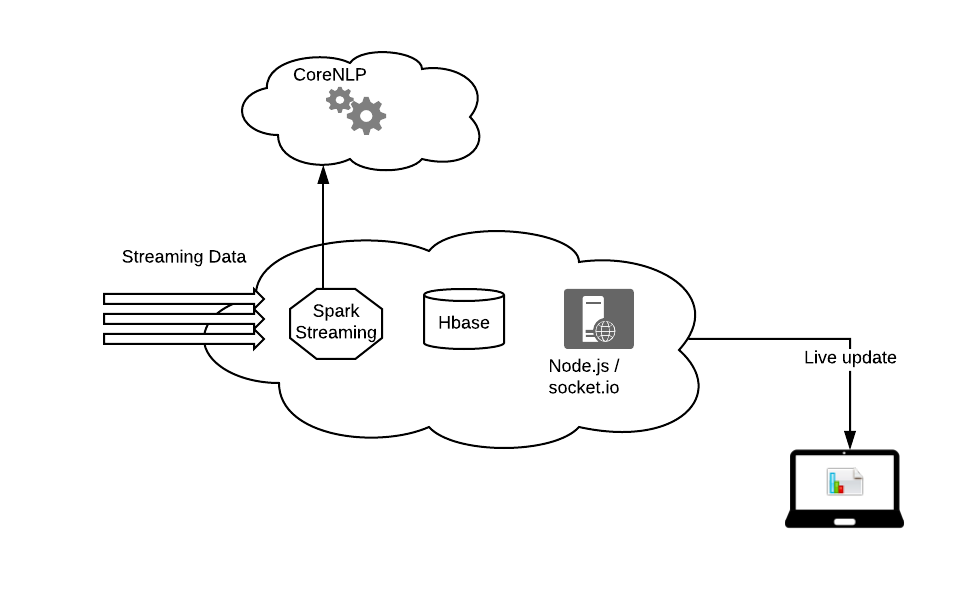
So whenever a streaming data enters the system, its sentiment is retrieved from the CoreNLP REST service and stored in Hbase. From there its pushed to the client browser by a Node.js server using socket.io, the d3.js on the web browser manipulates the incoming data and displays it as a live chart or table as required.
Connect the dots now:
Basically provided a technique which can be used for any realtime processing not limited to sentiment analysis....... How is this idea ?
About the Author: Manoharan D, Having two decades of IT industry experience, working for a private IT company in Chennai, India.
What is sentiment analysis? Sentiment Analysis is the process of determining whether a piece of writing is positive, negative or neutral.
In this blog let's see how to do real time sentiment analysis for twitter data. Use any keyword of your interest(ex. Big Data,IOT,machine learning) for filtering the streaming data using twitter API, for which sentiment needs to be analyzed.
Various components involved here are
- CoreNLP
- Stream Processing
- Storage
- Data transfer
- Visualization
CoreNLP:
We are going to use Stanford CoreNLP package for sentiment analysis. Assumption here is, if the text contains multiple sentences, sentiment of the longest sentence is considered to be the sentiment of the given text. This package is exposed through web server(tomcat) as a REST service.
Retrieve the sentiment using the method RNNCoreAnnotations.getPredictedClass(tree); which returns an integer as output, which needs to be interpreted as below.
0: "Very Negative"
1: "Negative"
2: "Neutral"
3: "Positive"
4: "Very Positive"
With this, for a given text, sentiment score is returned using HTTP method.
Stream Processing:
Using Apache Spark streaming to process the Twitter streaming data. The steps involves
- Retrieving data from Twitter stream.
- For each tweet, sending it to the coreNLP REST Service hosted on tomcat to get the sentiment for that tweet.
- Saving the tweet text and associated sentiment to the Hbase table.
Storage:
Store the streaming data to Hbase on hadoop cluster(Example).
Data transfer:
Now we have our data in Hbase, we can query the data from Hbase and present it as chart, refreshing the client every few seconds to make it as real time chart.
We are not going to use this technique, instead we will be using push model, whenever new data is arrived in Hbase, it is pushed to the client (in this case web browser) which makes it truly real-time.
Let's have a service which connects the data from Hbase to the chart in clients web browser. We have our data coming in to Hbase table , we have our chart loaded in the client web browser waiting to be updated.
Socket.io to our rescue:
Our orchestration server is built on node.js which monitors particular port for incoming messages and send that to the browser clients which are subscribed to it using socket.io.
Now we just need to push the data to the node.js server listening on a particular port, Hbase Coprocessor does that. Coprocessor is triggered whenever there is a data manipulation(get,put,delete), here we use postPut event, which is triggered after Hbase insert. Coprocessor is similar to trigger in RDBMS.
Our node.js process has two ports, tcp for incoming data and http for outgoing data. Hbase Coprocessor pushes the data in to the tcp port, which is then pushed to the client (example).
Data from the TCP stream is passed to the http server, which pushes data to the client using socket. io. This is possible because the tcp server and the http server runs inside the same node.js process.
Visualization:
Using d3.js create the charts (example). Use socket.io.js for realTime communication between the browser and server. Socket.io emits the data using this method in the browser, whenever data arrives in the server.
socket.on('emit_from_server', function(data){
.....
.....
})
Update the chart whenever data is emitted, thus making it real-time.
So whenever a streaming data enters the system, its sentiment is retrieved from the CoreNLP REST service and stored in Hbase. From there its pushed to the client browser by a Node.js server using socket.io, the d3.js on the web browser manipulates the incoming data and displays it as a live chart or table as required.
Connect the dots now:
Basically provided a technique which can be used for any realtime processing not limited to sentiment analysis....... How is this idea ?
Post your comments
About the Author: Manoharan D, Having two decades of IT industry experience, working for a private IT company in Chennai, India.
Archives
Jan-2019 Home automation on a weekend
Oct-2018 Coding Automation
Nov-2016 From HTML to Machine learning
Jan-2019 Home automation on a weekend
Oct-2018 Coding Automation
Nov-2016 From HTML to Machine learning